Why Teams Use AI for the Wrong Tasks: Gallup Data
AI models in this article
On 20 July, Gallup published its regular quarterly reading on AI adoption inside American companies. The headline is cheerful: 47% of employees say their organisation has integrated AI tools, up six percentage points in a single quarter. Until now, organisational adoption had lagged well behind individual use. Individual use keeps climbing as well: 52% of workers apply AI in their role, and 15% do it every day.
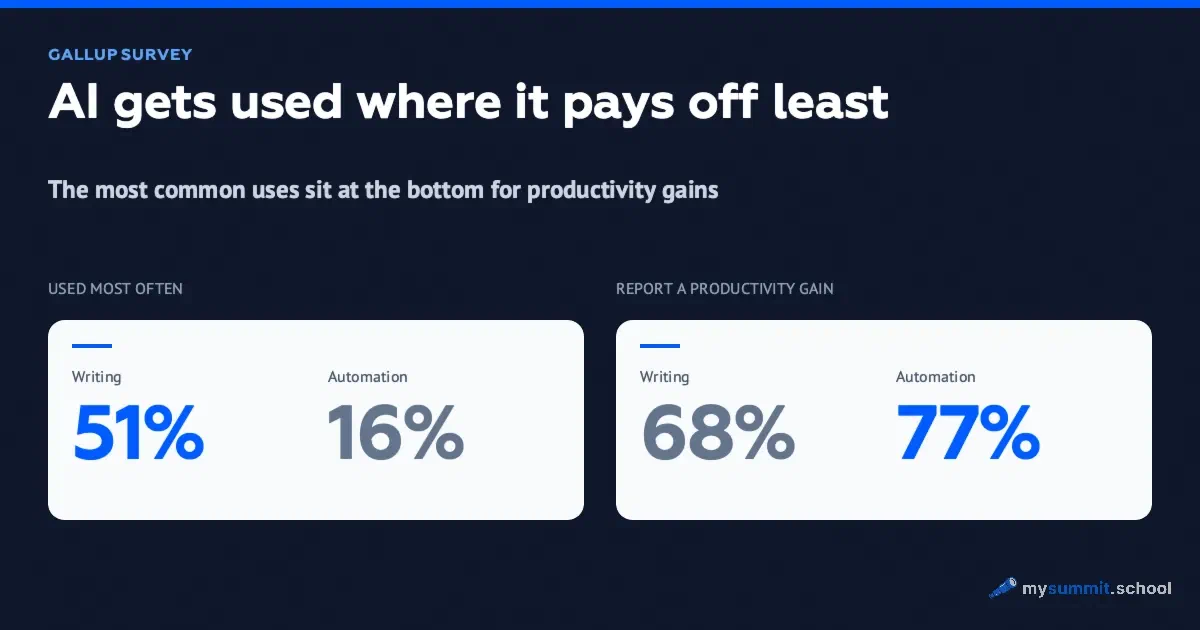
Then comes the table that sits awkwardly with all this optimism. The most common uses are writing and editing text (51% of AI users), search and research (49%), and general help with tasks (39%). Ask the same people where AI actually improved their productivity and the order flips. Coding help and process automation score highest at 77%, followed by presentations (76%) and analytics (75%). Text (68%) and search (65%) end up at the bottom.
So teams pile into exactly the uses that pay back least. The question worth asking is how much weight these numbers can carry, and what a project or product lead should take from them.
What Gallup measured
Start with the source, because “Gallup measured AI productivity” sounds bolder than the underlying work.
This is the quarterly Gallup Panel survey: a self-administered web questionnaire sent to a random sample of working adults in the US. The wave ran from 6 to 20 May 2026 and collected 22,573 responses, with a margin of error of ±0.9 percentage points. Solid methodology, as surveys go. What they asked is another matter. Everything Gallup knows about productivity here comes from respondents’ own assessment, and we will come back to that.
The core table looks like this. The left column is the share of AI users who apply the tool to a given use case. The right column is the share of those users who say AI had a positive effect on their productivity:
| Use case | Use it | Report a productivity gain |
|---|---|---|
| Writing and editing text | 51% | 68% |
| Search and research | 49% | 65% |
| General help, problem solving | 39% | 70% |
| Knowledge and information management | 31% | 72% |
| Email and communication | 29% | 72% |
| Meeting help, transcription | 19% | 73% |
| Data analysis, analytics | 18% | 75% |
| Presentations and slides | 17% | 76% |
| Image, video and audio generation | 17% | 70% |
| Coding help | 16% | 77% |
| Task, schedule and project management | 16% | 72% |
| Process automation | 16% | 77% |
Read the first column downwards and the second almost upwards. The uses most people pick up earn the most modest ratings. The uses with the best ratings have been adopted by 16–18% of users each.
There is a second pattern, this one about breadth. Among people who use AI for one or two tasks, 45% report a productivity gain. For three or four tasks it is 66%, for five or six 78%, and for seven or more 90%. The more thoroughly someone has built AI into their work, the higher they rate the return.
How far to trust these numbers
Three caveats before anyone builds an adoption plan on this.
The first is self-reporting. Productivity here is a feeling; the survey contains no objective measurement. People who have put effort into learning the tool tend to defend that choice. The survey also cannot see the quality of the output, or the time spent checking and redoing it. That bill is substantial: according to Workday’s data, almost 40% of the time saved with AI goes back into fixing its mistakes. Gallup measured nothing of the kind.
The second is correlation. The 45–66–78–90% ladder reads like “add use cases and the gains follow”. Gallup itself warns against that reading. It may simply be that people who take to AI find more places to use it, and that some roles offer more entry points than others. Hand a sceptic four new use cases and their self-rated productivity will not budge. Other studies point the same way: Epoch AI and Ipsos found that 62% of users apply AI to just one or two tasks. And the pattern is stable over time. Breadth does not widen by itself.
The third is geography, plus a very soft definition of adoption. The sample covers the US only, with its particular access to tools and process maturity. The adoption figure is soft too: 47% means an employee believes their organisation has integrated AI “to improve productivity, efficiency or quality”. That wording covers a genuine process redesign and a licence bought once and mentioned in a company newsletter. Tellingly, one in five respondents has no idea whether their company adopted AI at all, and that share has not moved for several quarters.
None of this cancels the main finding. The gap between 65% and 77% survives every way of checking it: it shows up in the self-assessments, and in the behaviour of the respondents themselves, since frequent users drift steadily towards specialised use cases. People who work with the tool every day vote for the difference with their own habits.
Four levels of maturity: where your team sits
The most practical part of the study compares frequent and occasional users. Frequent users (several times a week or more) use AI more widely across the board, but the gap is spread very unevenly:
| Use case | Frequent users | Occasional users |
|---|---|---|
| Coding help | 22% | 8% |
| Process automation | 21% | 8% |
| Task and project management | 21% | 9% |
| General help, problem solving | 48% | 28% |
| Writing and editing | 58% | 41% |
| Search and research | 54% | 42% |
On writing and search, frequent users run about 50% ahead of occasional ones. On coding, automation and project management, almost threefold. Gallup puts it carefully: frequent users apply AI to tasks where the tool has a clear link to a specific part of their job.
Those figures add up to four levels of maturity you can check your own team against.
Level 1. Text and search (65–68% effect)
Drafting emails, summarising documents, answering reference questions. A sensible place to start, and where most people are. It becomes a problem when the team is still there a year later: by then it is collecting the weakest return in the study.
Level 2. Communication and knowledge (72%)
Sorting the inbox, meeting minutes, working with the knowledge base. AI is connected to the team’s process now, though still on supporting tasks.
Level 3. Analytics and presentations (75–76%)
Reading sprint metrics, preparing material for stakeholders, analysing pulse survey results. Here the model works with project data and its output needs checking, but the return is noticeably better.
Level 4. Automation and project management (72–77%)
Recurring reporting assembled from raw input without anyone touching it: minutes turn into a risk register, team updates into a summary for leadership, a change in the inputs into a recalculated plan. For a project manager this is the core of the job, and it is also where Gallup finds one of the widest gaps between frequent and occasional users: 21% against 9%.
One line deserves separate attention: the 20% of employees who do not know whether their company has adopted AI. That is a communication diagnosis. An adoption that a fifth of the workforce has never heard of exists mainly in a slide deck. Gallup’s earlier research ties usage directly to support from the team’s manager. We saw the same picture in last year’s Gallup reading and in our breakdown of Google ATLAS (in Russian): broad reach with shallow depth, a pattern that repeats from one survey to the next.
The levels look simple until you try to move a real team up them. Each step is a change in the brief you give the model: from “write this text” to “read the data and give me decisions”. The fastest way to feel the difference is to try it yourself.
Work through 9 real manager tasks with AI – from drafting an email to picking apart project risks. Free, no registration
No payment required • Get notified on launch
Demo: from a call transcript to a risk register
Here is level four in miniature. The prompt below already contains a transcript of a typical status call: a minute and a half of reading, five risks buried in ordinary chatter. The model has to pull out a risk register with supporting quotes, a report for the director and a list of what is missing. That is analytical work, a couple of levels above “make this email sound friendlier”. Run it as it stands, then swap in a transcript from one of your own calls.
The models were chosen using our benchmark – hover over a name to see the current figures. Kimi K3 tops two of the categories that matter here: analysis and decisions, and planning. Its documented strengths sit exactly there – reframing the problem, building scenarios, producing ready-to-use tables. GPT-5.6 Sol leads the overall table and stays near the top on analysis and decisions; it is known for structured breakdowns and for being honest about the limits of the data.
I ran this prompt on both models on 18 August. Each found all five risks planted in the transcript: the failing bank environment, the single owner of the payment module going on leave, the client’s request for an upload through the e-government portal, no slack in testing, and the 4% of broken records in the migration. Both models supported every risk with a quote, which matters because a quote lets you check the conclusion in seconds.
What to look at in the answer. First, the last block of the director’s report: it should name the specific decisions you are asking leadership for. That block is what separates an analytical artefact from a meeting summary. Second, the derived numbers. Kimi K3, for instance, worked out from “4% = 80,000” that the full database holds roughly 2 million records. The arithmetic is right, but it is the model’s own inference, and precise figures are a documented weak spot for it – check those by hand. A related question is how hard a model holds its ground when you push back: in our study of sycophancy, pressure without new facts regularly moves the answers, so arguing with the model is part of the check. Third, the missing-information block: that is where the model’s work ends and the manager’s begins. The model shows honestly what the transcript does not contain; only someone with access to the project can go and get it.
That call was not yours, and it took a minute. Now do the same with tasks from your own work: 9 scenarios for managers, free
No payment required • Get notified on launch
Start next week
Four actions follow from the study for anyone managing a team.
Take inventory. Write down what your team actually uses AI for and sort those use cases into the four levels. If the list is all text and search, you are at the Gallup median, where 45–68% of users feel a productivity gain, and the ceiling of that setup is known.
Move one task up a level. Pick a recurring reporting task – the weekly status is the best candidate – and rewrite it from “draft this text” into “read the raw input and give me decisions”. The prompt above works as a starting point, and we went through the full working cycle of that automation in the article on reports and status updates with AI. The difference shows within one or two weeks, and it is larger than anything you get from switching models.
Pair people up. Gallup’s data show frequent users applying specialised use cases two or three times as often as occasional ones. Put your most advanced user alongside your most cautious one on a single real task. It costs less than any training course, and what gets passed on is exactly what courses cannot pass on: the habit of tying the tool to a specific part of the job.
Measure rework instead of feelings. Gallup measures perceived productivity, a useful mood indicator and a weak management metric. Your internal number is the hours the team spends checking and correcting AI output. If that counter grows faster than the savings, you are climbing the levels too quickly for your quality bar. Some of the cost cannot be counted in hours at all: thinking quietly replaced by ready-made answers (in Russian).
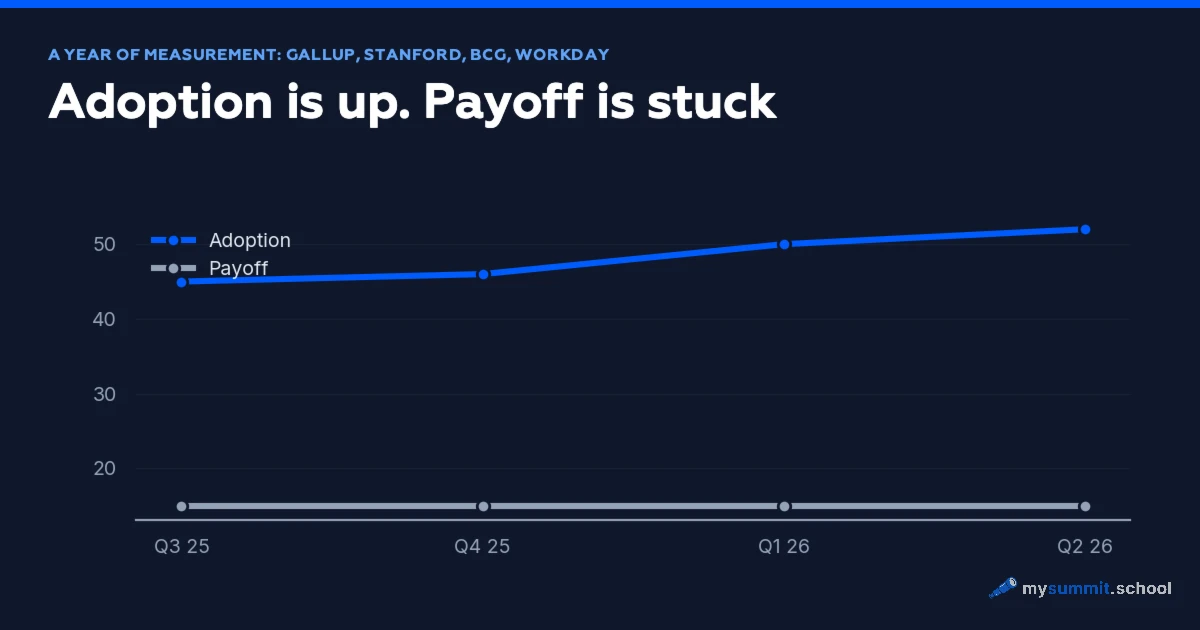
And the wider conclusion. Gallup’s headline is about adoption growth. For a manager, the substance lies elsewhere: adoption on its own says almost nothing about return. The level a team has reached says everything. While its use cases remain text and search, it earns precisely the 65–68% that Gallup recorded in the bottom rows of its table. How this reading fits into a year of watching such reports is the subject of our review of two curves: adoption rising in a straight, predictable line while the return barely moved over the same year.
You already have the popular use case. Now learn the one that pays
Project Management specialisation: status reports, risks, reporting for leadership, replanning – specialised AI use cases on your own project, with review and feedback.
Source: Kemp A. Organizational AI Adoption Jumps Six Points. Gallup, 20 July 2026. Gallup Panel survey, 6–20 May 2026, n = 22,573 working adults in the US, margin of error ±0.9 pp. Also: Gallup on the manager’s role in AI adoption.
Часто задаваемые вопросы
What do employees use AI for most often, according to Gallup?
Which AI use cases deliver the biggest productivity gains?
Does the Gallup study prove that adding use cases raises productivity?
Where should a team start when moving to specialised AI use cases?

Stanislav Belyaev
Engineering Leader at Microsoft18 years leading engineering teams. Founder of mysummit.school. 700+ graduates at Yandex Practicum and Stratoplan.